Wallboards
Wallboards is the tool that allows you to visualize information graphically in a series of panels within uContact. Each panel displays a chart that represents a set of data. These are very useful for facilitating data comparison and decision-making.
Permissions
When we talk about wallboards, in addition to the ordinary permissions such as view, create, delete, and modify, there are also certain special permissions such as query and share, below is a brief explanation of them.
Common permissions
In wallboards exists some common permissions, below is a explanation of each one.
View permission
Allows the user to view existing wallboards.
 Create permission
Create permissionAllows the user to create new wallboards.
 Edit permission
Edit permissionAllows the user to work on existing wallboards, including adding or removing charts within the wallboard.
 Delete permission
Delete permissionAllows the user to delete wallboards.
Special permissions
In wallboards exists some special permissions, below is a explanation of each one.
 Query permission
Query permissionAllows the user to create custom queries to obtain data from the database.
 Share permission
Share permissionAllows the user to obtain a link that can be sent to other people to view the wallboard, which will only grant view permission.
Panels and their types
Panels are those that allow us to visualize information within a wallboard. There are different types of panels to model data differently. Each type of panel has its own function and specific characteristics that allow the user to customize the data visualization according to their needs. Below is a brief explanation of each type of panel available in Wallboard and its main features.
 Bar chart
Bar chartIt allows us to compare different sets of data using vertical bars. It is useful for showing comparisons of quantities or data that are not necessarily related to time. For example, it can be used to show the number of typifications according to name.
 Line chart
Line chartIt allows us to visualize data over time in a visual and clear way. It is useful for comparing trends and seeing how data evolves. For example, it can be used to show the evolution of incoming interactions on a campaign.
 Donut chart
Donut chartIt allows us to show the proportion of different sets of data using a donut graph. It is useful for showing percentages and proportions. For example, it can be used to show the relationship between logged-in time and break time.
 Pie chart
Pie chartIt allows us to show the proportion of different sets of data using a donut graph. It is useful for showing percentages and proportions. For example, it can be used to show the relationship between logged-in time and break time. The difference between this type of chart and the donut chart is that the donut chart has a hole in the center.
 Table chart
Table chartIt allows us to display data in a table format. It is useful for showing a large amount of data in a single view. For example, it can be used to display detailed information about campaigns.
 Total
Total
TotalIt allows us to display a total value of a set of data for the interval of time that we established on the global filters. It is useful for showing a total value of a set of data. For example, it can be used to show the total number of interactions received in a campaign.
Sources & Metrics
When we create a panel within a wallboard, we must choose its source and metrics. The source refers to the place from which we want to obtain data and the metrics refer to the data we want to obtain. Within wallboards, we have the following sources available:
 Campaigns
CampaignsWithin this source, we will find everything related to the different campaigns. For example: service level, incoming messages, outgoing messages and others! (To see all the metrics of campaigns, )
 Agents
AgentsWithin this source, we will find everything related to agents. For example: logged-in time, adherence time, number of calls answered and more! (To see all the metrics of agents, refer to )
 Outbound Hub
Outbound HubWithin this source, we will find everything related to dialers. For example: outgoing calls, failed calls, etc. (To see all the metrics of dialers, )
 Custom queries
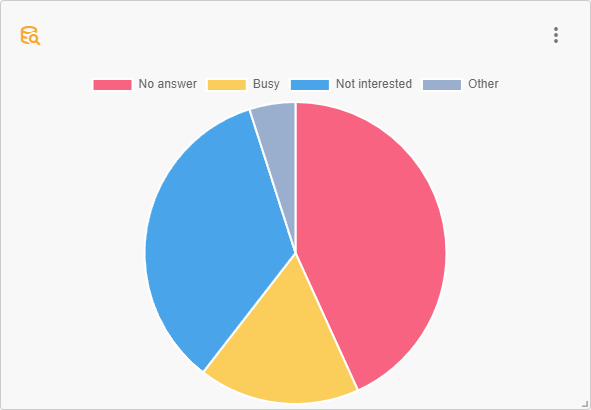
Custom queriesThis source does not have predefined metrics. We will have to create a query to obtain and model the data to our liking. When using a query to obtain data, we must write an SQL statement that will obtain the information directly from the database. For this, it is necessary to have knowledge of how these queries are constructed, as well as the permissions mentioned earlier. Below is an example of a query, the type of graph it was modeled on, and what was being sought to obtain.
SELECT
  COUNT(CASE WHEN value1 = 'No answer' THEN 1 END) AS 'No answer',
  COUNT(CASE WHEN value1 = 'Busy' THEN 1 END) AS 'Busy',
  COUNT(CASE WHEN value1 = 'Not interested' THEN 1 END) AS 'Not interested',
  COUNT(CASE WHEN value1 NOT IN ('No answer', 'Busy', 'Not interested') THEN 1 END)
   AS 'Other'
FROM ccrepo.dispositions_repo;
This query aims to obtain data on typifications grouped by their name, in this way we hope to be able to compare the different level one typifications. This query is very useful for us to visualize it within a pie chart and thus compare the totals with each other.
If you want to know more about how to create queries, refer to the [Queries](/src/supervisor/wallboards.html#queries) section.
Filters
Filters are employed to refine the data displayed either within a specific panel or across the entire wallboard. These filters come in two main categories: community filters and personal filters. Community filters exert their influence universally, impacting all users with access to the wallboard once applied. Conversely, personal filters are tailored exclusively for the user implementing them.
Furthermore, we differentiate between global filters and local filters. Global filters wield authority over all panels within the wallboard, applying their criteria comprehensively. In contrast, local filters confine their impact solely to the panel in which they are configured. Here's a succinct overview of each filter type.
Below is a brief explanation of each type of filter.
WARNING
The Time section pertains to the specific time frame we wish to retrieve data from, while the Filters section addresses the specific resources or sources from which we seek to extract data. It's worth noting that the Time section is exclusively accessible within the global filter settings.
Time
Interval
Select the interval of time that we want to use to obtain data. The options are the following:
- 15 minutes
- 30 minutes
- 1 hour
- by day
- by week
- by month
- by bimester
- by trimester
- by quarter
- by semester
- by year
These options will never appear all together, as the system is designed to show us the best grouping options based on what we have specified in the from field. This means that, for example, if we select last day as the from value, then we can only group the data by the first four options
Since
Specify the time period from which we want to obtain data, the options are the following:
- last 6 hours
- last 12 hours
- last day
- last 2 days
- last 3 days
- last week
- last 2 weeks
- last month
- last 2 months
- last trimester
- last quarter
- last semester
- last year
- custom
All these options, except for custom, will take the bounded time period where the relationship occurs, which means, for example, if we select last quarter, it will take the last quarter from the current date, so if we are in 04/24/2023, the time period that will be taken will be from 04/01/2023 to 06/30/2023
If we select custom, we will be able to select the exact time period we want to take. To do this, we must select the start date and the end date. The start date must be before the end date, otherwise we do not obtain any data.
Start date
Only appears when we select custom in the since field. It allows us to select the start date of the time period we want to take. We be able to select dates that correspond to the selected in the interval field. For example, if we select by month as the interval field, then we will only be able to select dates that are the first day of the month and the hour will be 00:00:00.
End date
Only appears when we select custom in the since field. It allows us to select the end date of the time period we want to take. We be able to select dates that correspond to the selected in the interval field. For example, if we select by month as the interval field, then we will only be able to select dates that are the last day of the month and the hour will be 23:59:59.
Filters
Filters section refer to the existing resources from which we want to obtain data. Within this section, we will only be able to see the fields for which we have created panels. This means, for example, that the agents field will only appear if we have a chart that uses the agents source. If we have a panel that uses a custom query, then all fields will be visible. Within this section, we will find the following elements:
Campaigns
List of campaigns that we want to obtain data from. This list will only appear if we have created a panel that uses the campaigns source and the campaigns that we will see in this list are the ones that are created in the platform.
Channels
List of channels that we want to obtain data from. This list will only appear if we have created a panel that uses the campaigns source and we see all the channels that are available in the platform.
Group by
This field is a switch, that only appears if we have created a panel that uses the campaigns source. It allows us to group the data by campaign or by channel. If we select campaign, then the data will be shown by campaign, if we select channel, then the data will be shown by channel.
Agents
List of agents that we want to obtain data from. This list will only appear if we have created a panel that uses the agents source and the agents that we will see in this list are the ones that are created in the platform.
Outbound Hub
List of dialers that we want to obtain data from. This list will only appear if we have created a panel that uses the dialers source and the dialers that we will see in this list are the ones that are created in the platform.
Manage Wallboards
Create a wallboard
Create a wallboardTo create a wallboard satisfactorily, it is necessary to follow a series of simple steps: 
- Go to the Wallboards tab in the platform.
- Click on the "New" button in the top right corner of the screen or use the keyboard shortcut "Alt+Shift+N".
- Enter a name for the wallboard (this field is mandatory) we will identify the wallboard with this name.
- Write a short description (this field is optional) to clarify or provide more information about the wallboard, such as its purpose or any other relevant information fo you. The name can't be changed in the future.
- Click on the "Create" button to create.
Once created, we can access the wallboard and start adding panels to it! Really easy!
Edit a wallboard
Edit a wallboardTo edit a wallboard, we must follow the following steps:
- Go to the Wallboards tab in the platform.
- Click on the three dots that appear in the right corner of the wallboard that we want to edit.
- Click on the "Edit" option.
- Make the necessary changes.
- Click on the "Save" button to save the changes.
Delete a wallboard
Delete a wallboardTo delete a wallboard, we must follow the following steps:
- Go to the Wallboards tab in the platform.
- Click on the three dots that appear in the right corner of the wallboard that we want to delete.
- Click on the "Delete" option.
At this point, a alert will appear asking us to confirm the deletion of the wallboard, if we want to delete it, we must click on the "Delete" button, otherwise, we must click on the "Cancel" button.
Inside a Wallboard
Adding a Panel
Panels in a wallboard can be created by following some simple steps.
- Go to the panel on the right side of the screen, where the different types of panels available can be viewed.
- Select the desired panel type.
- Click on the source that you want to use to obtain the data. (For more information on available sources, please refer to the Sources & Metrics section)
At this point, we have already created the panel, now we just need to make the corresponding adjustments.
Selecting metrics
- Click on the metrics icon.
- Select the metrics that we want to use to obtain the data
- Click on save.
Adjust Filters
To know how to adjust the filters, please refer to the section Local Filters
Adjust Other Settings
Depending on the type of chart, there may be certain additional settings that can be very helpful for visualizing the information in the necessary way. The following explains how to access these settings:
- Click on the settings menu.
- Go to the configuration section.
- Modify the settings to our liking.
- Click on save.
Personalizing a Chart
We can personalize a chart editing the colors of the chart. To do this, we must follow the next steps:
- Click on the settings icon.
- Go to the colors section.
- Modify the colors to our liking.
- Click on save.
Editing a Panel
To edit a panel, we must follow the next steps:
- Go to the Wallboards tab in the platform.
- Open the wallboard that contains the panel that we want to edit.
- Click on the three dots that appear in the right corner of the panel that we want to edit.
- Click on the "Edit" option.
- Make the necessary changes. We can edit the following elements:
- Title: To change the title of the panel, we must click on the title and write the desired title.
- Description: To change the description of the panel, we must click on the description and write the desired description.
- Source: To change the source of the panel, we must click on the source icon and select the desired source.
- Query: To change the query of the panel, we must click on the query icon and write the desired query.
- To save the changes, we must click on the Source icon. If we select Query, the changes will be saved when we save the query.
If we want cancel the changes, we must click on the cross icon. Located in the top right corner of the panel. This will bring up a confirmation alert, if we want discard the changes, we must click on the "Confirm" button, otherwise, we must click on the "Cancel" button.
Deleting a Panel
To delete a panel, we must follow the next steps:
- Go to the Wallboard tab in the platform.
- Open the wallboard that contains the panel that we want to delete.
- Click on the three dots that appear in the right corner of the panel that we want to delete.
- Click on the "Delete" option. At this point, an alert will appear asking us to confirm the deletion of the panel, if we want to delete it, we must click on the "Delete" button, otherwise, we must click on the "Cancel" button.
Moving and Resizing a Panel
One of the most important features of a wallboard is the ability to move and resize the panels. This allows us to organize the panels in the way that best suits our needs. Is important notice that depending the size of the screen, the panels will be organized in a different way. It means that if we have a small screen, the panels will be organized in a single column, while if we have a large screen, the panels will be organized in multiple columns.
At next, we will explain how to move and resize a panel.
- To move a panel, we must click on the panel and drag it to the desired position.
- To resize a panel, we must click on the icon located in the bottom right corner of the panel and drag it to the desired size.
After moving or resizing a panel, a button will appear in the bottom right corner of the panel, this button allows us to save the changes. If we want to discard the changes, we must reload the page.
Global and Local Filters
This section has the purpose of explaining the differences between global and local filters and how to use them.
When we create a wallboard, we can use global filters and local filters to filter the information that we want to see in the panels. The difference between these is that the global filters affect all the panels of the wallboard, while the local filters only affect the panel in which they are configured. Additionally, global filters is the only way to filter the information of the panels that use the source "Query".
Global Filters
To configure the global filters, we must follow the following steps:
- Go to the filter icon located in the bottom right corner of the screen. This will appear a panel in the right side of the screen with the global filters.
- Modify the filters to our liking.
At this point, we have already configured the global filters, now we just need decide if we want to apply the filters with personal scope or with global scope. If we want to apply the filters with personal scope, we only need to click on the "Close" button. If we want to apply the filters with global scope, we must click on the "Apply Globally" button.
After applied the filters we see a loader icon in each panel, this means that the information is being updated. When the loader icon disappears, the information will be updated.
Local Filters
If we want our panel to use information different from what is configured in the global filters, we must open the local filters. The following explains how to configure these filters:
- Click on the settings icon.
- Go to the filters section.
- Modify the filters to our liking.
At this point, we have already configured the local filters, now we just need decide if we want to apply the filters with personal scope or with global scope. If we want to apply the filters with personal scope, we only need to click on the "Save" button. If we want to apply the filters with global scope, we must click on the "Apply Globally" button.
After applied the filters we see a loader icon in the panel, this means that the information is being updated. When the loader icon disappears, the information will be updated.
Sync with global filters
If we configure the local filters and we want to use the global filters again, we must follow the following steps:
- Click on the settings icon.
- Go to the filters section.
- Click on the "Sync with global filters" button.
- Click on save.
After applied the filters, we will see a loader icon in the panel, this means that the information is being updated. When the loader icon disappears, the information will be updated.
Also exist a second option if we want use a mix of the global filters and the local filters, this option is the following:
- Click on the settings icon.
- Go to the filters section.
- Set the filters to our liking.
- Let empty the filters that we want to use the global filters.
- Click on save.
This option is useful when we want to use the global filters but we want to filter the information of a specific resource or something similar.
Advanced Settings
This section has the purpose of explaining the advanced settings of the panels. These settings are very useful when we need get specific information from the panels. Here explains how create a query and custom metrics.
Custom Metrics
Wallboards come with a set of predefined metrics that we can use to obtain data. However, sometimes we need to obtain data that is not available in the predefined metrics. In such cases, we have the option to create custom metrics based on the existing predefined ones.
To create a custom metric, we must follow the next steps:
- Click on the metrics icon.
- Go to the custom section.
- Click on the "New" button.
- Select the type of metric that we want to create>: Time, Quantity or Percentage.
- Enter a name for the custom metric (this field is mandatory) that identifies it.
- Write the mathematical expression that we want to use to obtain the data. example:
inInteractions + outInteractions - Click on the "Save" button to save the custom metric.
After created the custom metric, the metric will be available in the bottom of the metrics list. To use the custom metric, we must click on the metric and then click on the "Save" button.
Query
Before we start, we must know how is the structure of the query. The following explains the structure of the query:
If we create a query for a bar chart or a line chart, the structure of the query must be the following:
SELECT
    <first_field> AS <first_field_alias>, / This represents the axis X of the chart
    <other_fields> AS <other_fields_alias> / This represents each of the bars or lines of the chart
FROM
    <table>
WHERE
    <filter>
GROUP BY
    <group_by>
If we create a query for a pie chart, the structure of the query must be the following:
SELECT
    <first_field> AS <first_field_alias>, / This represents the name of the slice of the chart
    <other_fields> AS <other_fields_alias> / This represents the value of the slice of the chart
FROM
    <table>
WHERE
    <filter>
GROUP BY
    <group_by>
If we don't specify a limit in the query, the platform will use the limit set on configuration. If we don't specify a group by in the query, the platform will use the group by set on configuration.
When we create a query, if we want to use some of the global filters, we have the next variables:
- ${start}: this variable represents the start date selected in the global filters.
- ${end}: this variable represents the end date selected in the global filters.
- ${campaigns}: this variable represents the campaigns selected in the global filters.
- ${channels}: this variable represents the channels selected in the global filters.
- ${agents}: this variable represents the agents selected in the global filters.
- ${dialers}: this variable represents the dialers selected in the global filters.
- ${quality}: this variable represents the quality models selected in the global filters.
Here is an example of a query with use of variables:
SELECT
    agent,
    AVG(qualification) as qualification
FROM
    ccrepo.customer_feedback
WHERE
    campaign in (${campaigns}) and agent in (${agents})
    and datetime between '${start}' and '${end}'
GROUP BY
    agent
The result of this query will be a pie chart with the average qualification of each agent. 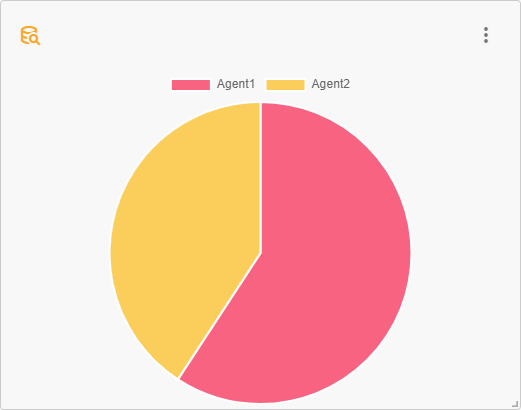
Common errors
When we create a wallboard, we may encounter some errors that prevent us to see the information that we expect. The following explains the most common errors and how to solve them:
Error: "No metrics selected"
This error occurs when we have not selected any metric for the panel. To solve this error, we must select at least one metric. Every time we create a panel, this error will appear until we select at least one metric. If you don't know how to select a metric, please refer to the section Selecting metrics.
Error: "No resources selected"
This error occurs when we have not selected any resource for the panel. This error have two possible causes:
- The first cause is that we have not selected any resource in the global filters. To solve this error, we must select at least one resource in the global filters.
- The second cause is that we have not selected any resource in the local filters. To solve this error, we must select at least one resource in the local filters.
To solve this error, exist three possible solutions:
- The first solution is to select at least one resource in the global filters. Refer to the section Global Filters to know how to do this.
- The second solution is to select at least one resource in the local filters. Refer to the section Local Filters to know how to do this.
- The third solution is synchronize the local filters with the global filters. If you don't know how to do this, please refer to the section Sync with global filters.
Error: "No resources available"
This error occurs when we have not created any resource. To solve this error, we must create at least one resource. It means that we don't have any campaign, agent, dialer or other resource created.